My friend and colleague (I like him even more since he told me about this!) Segev gave me this information, which he had gleaned from some old posts on ROOTtalk and a lot of experimentation. It’s a technique for setting the color palette of ROOT plots so that, for example, Graph2D with the “COLZ” option doesn’t look like total crap. I have no idea why something like this isn’t used as the default palette in ROOT.
In short, here’s before and after screenshots of the plot.
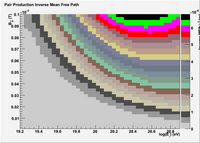 Before
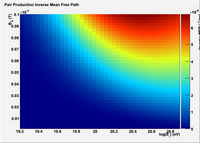 After
After
The standard palette in ROOT is so ugly it makes me want to hurl. It’s probably one of those things that some genius programmer or physicist came up with, so I don’t mind that the first attempt was ugly. ROOT is powerful and Free, so that’s all good. I do find it weird that they’ve no-one has ever replaced it as the default.

Woah! Who threw up on my plot?
Fortunately for all of us, there is a choice of two palettes to choose from in ROOT by default. The interface for setting the palette is not accessible through the GUI, but in code or in CINT one can type
gStyle->SetPalette(1);
to get the rainbow palette. Here’s what that looks like:

The rainbow palette is a lot nicer, both aesthetically and, in my opinion, it makes the ‘hot’ areas much clearer to the eye. However, by default there are still only twenty or so different colors by default and the whole thing is dominated by a big pile of green. Still not quite perfect.
Entering other numbers into gStyle->SetPalette seems to give some blocky gray plots and eventually a blue plot. Nothing as nice as the rainbow plot. However, there is a way to define new color palettes and use them. Here’s the example code as provided by Segev. :
void
set_plot_style()
{
    const Int_t NRGBs = 5;
    const Int_t NCont = 255;

    Double_t stops[NRGBs] = { 0.00, 0.34, 0.61, 0.84, 1.00 };
    Double_t red[NRGBs]   = { 0.00, 0.00, 0.87, 1.00, 0.51 };
    Double_t green[NRGBs] = { 0.00, 0.81, 1.00, 0.20, 0.00 };
    Double_t blue[NRGBs]  = { 0.51, 1.00, 0.12, 0.00, 0.00 };
    TColor::CreateGradientColorTable(NRGBs, stops, red, green, blue, NCont);
    gStyle->SetNumberContours(NCont);
}
Note: This version works in ROOT v5.16, earlier versions may have used gStyle->CreateColorGradientTable() instead of TColor::CreateColorGradientTable().

Note too that the wonderful gStyle->SetNumberContours(NCont) is what gives the plot its smooth appearance, a big improvement in itself from the default 20 or so colors.
Here’s my Python function for the same effect:
def set_palette(name=palette, ncontours=999):
    """Set a color palette from a given RGB list
    stops, red, green and blue should all be lists of the same length
    see set_decent_colors for an example"""

    if name == "gray" or name == "grayscale":
        stops = [0.00, 0.34, 0.61, 0.84, 1.00]
        red   = [1.00, 0.84, 0.61, 0.34, 0.00]
        green = [1.00, 0.84, 0.61, 0.34, 0.00]
        blue  = [1.00, 0.84, 0.61, 0.34, 0.00]
    # elif name == "whatever":
        # (define more palettes)
    else:
        # default palette, looks cool
        stops = [0.00, 0.34, 0.61, 0.84, 1.00]
        red   = [0.00, 0.00, 0.87, 1.00, 0.51]
        green = [0.00, 0.81, 1.00, 0.20, 0.00]
        blue  = [0.51, 1.00, 0.12, 0.00, 0.00]

    s = array('d', stops)
    r = array('d', red)
    g = array('d', green)
    b = array('d', blue)

    npoints = len(s)
    TColor.CreateGradientColorTable(npoints, s, r, g, b, ncontours)
    gStyle.SetNumberContours(ncontours)
And that’s how you do it. Thanks Segev!
19 replies on “Making Pretty ROOT Color Palettes”
[…] http://ultrahigh.org/2007/08/20/making-pretty-root-color-palettes/ […]
Thank you random internet stranger
Excellent! Thanks…
Thanks,
you just made my plots look nice…
Thanks a bunch, looks so much better ! :D
Thanks!
That looks awesome!
Great Job.
Extremely useful hint
Thanks
Great!
Thanks so much!
Cool, thanks a lot, works like a charm…
Cool,
that’s exactly what I was searching for,
thank you a lot vice-brun : )
Just a note for folks having problems. There is a typo in the note for anyone using older versions of ROOT: the function name is CreateGradientColorTable not CreateColorGradientTable.
Also, I couldn’t get this to work when I had both “gStyle->SetPalette(1)” and the code for defining your own palette included at the same time. Obvious now, but I didn’t figure it out for some time.
Awesome, thanks man!
I had to change the first line of the python script to
def set_palette(name=’palette’, ncontours=999):
but works like a dream apart from that!
Well done! Thanks!
But a question: How can I use it?
(newbie in root’s world)
thanks
I think that you must change the python function definition to
def set_palette(name=None, ncontours=999):
because palette is not defined
If I am not wrong the default palette is the one it looks ugly and the reason is for computers which has low end graphic card or for very old time computers, and the user could change it easily, as you showed, and there is a lot of people doesn’t know that option.
I have just found the justification for the reason of ugly looking palette.
… the default colors on the 2D histogram… are the palette of 16 colors computers used about 20 years ago! …
http://www.cernlove.org/blog/2009/10/the-root-of-all-evil/#comment-49
worked perfectly! thank you
new ROOT versions have a much improved default style, see this post from Axel . Nevertheless, your color palette is really nice, thanks for the tip!
thanks for posting this code, makes very nice plots, it’s useful even 6 years after the initial post :-)